Every browser event, collector signal, and policy decision in one governed stream.
Kairro turns AI activity into structured telemetry for visibility, findings, investigations, integrations, and governance. Teams can see what happened, why it happened, and what it means without stitching together separate event systems.
What Kairro Captures
A central event system enriched with DLP, shadow AI, collector state, and operational context.
Prompt evaluations and tool usage
Captured with rich context and indexed for fast analytics.
- Org & identity: org, user/identity, browser client, extension
- AI tool & endpoint: provider/tool used
- Action & status: allow / warn / block, and why
- Prompt & response summary: redacted, length-limited
- DLP impact: matched severity and patterns
- Tokens & metadata: usage and diagnostics
Workstation signals and posture
Collectors contribute device posture, review decisions, and governed workstation activity.
- Policy sync and release posture
- Review and command activity
- Linked device and investigation context
Answer which devices are healthy, drifted, stale, or waiting on review.
Unknown, risky, and escalated usage
Signals become findings and investigations instead of staying raw telemetry only.
- Hostname, URL, severity, identity, and device metadata
- Feeds inventory, findings, investigations, and governance views
How Events Flow Into Kairro
Telemetry designed around real browser activity, workstation coverage, and security signals.
1) Browser prompt evaluations
Every approved AI interaction calls evaluate:
- Policy decision (Allow/Warn/Block)
- Logged Event + DlpMatches (if present)
- Optional notifications and integration pushes
2) Collector activity and review flows
Collectors contribute device posture, policy sync state, and governed review events:
- Endpoint context, device posture, and recent command activity
- Review and decision metadata tied to investigations
Stored as governed telemetry and linked to device and investigation views.
3) Shadow AI reports via API
External systems can still POST signals beyond managed browsers when you need to bring more discovery into Kairro.
4) Ops & Health Signals
Ops dashboard uses event/endpoint data to track evaluate errors, active endpoints, notification delivery, DLP blocks, and high/critical incidents.
Intelligent Logging & Redaction
Rich telemetry balanced with privacy and performance.
Per-org logging levels
Configurable detail via notificationConfig.eventsLoggingLevels before anything is persisted.
Redacted, length-limited content
Prompts, responses, and DLP snippets truncated to 256 chars with offsets/pattern metadata, not full documents.
Events → Integrations & Notifications
The same pipeline powers outbound signal flows.
Outbound integrations
Structured payloads to SIEM/logging, security analytics, webhooks, and custom pipelines.
Includes core event fields, DLP summary, metadata, and tracks delivery/last errors.
Notification engine
Evaluates type, risk/severity, and org thresholds; routes alerts to Slack, email, Teams, PagerDuty, Opsgenie, and webhooks. Tracks notification objects, deliveries, and channel health.
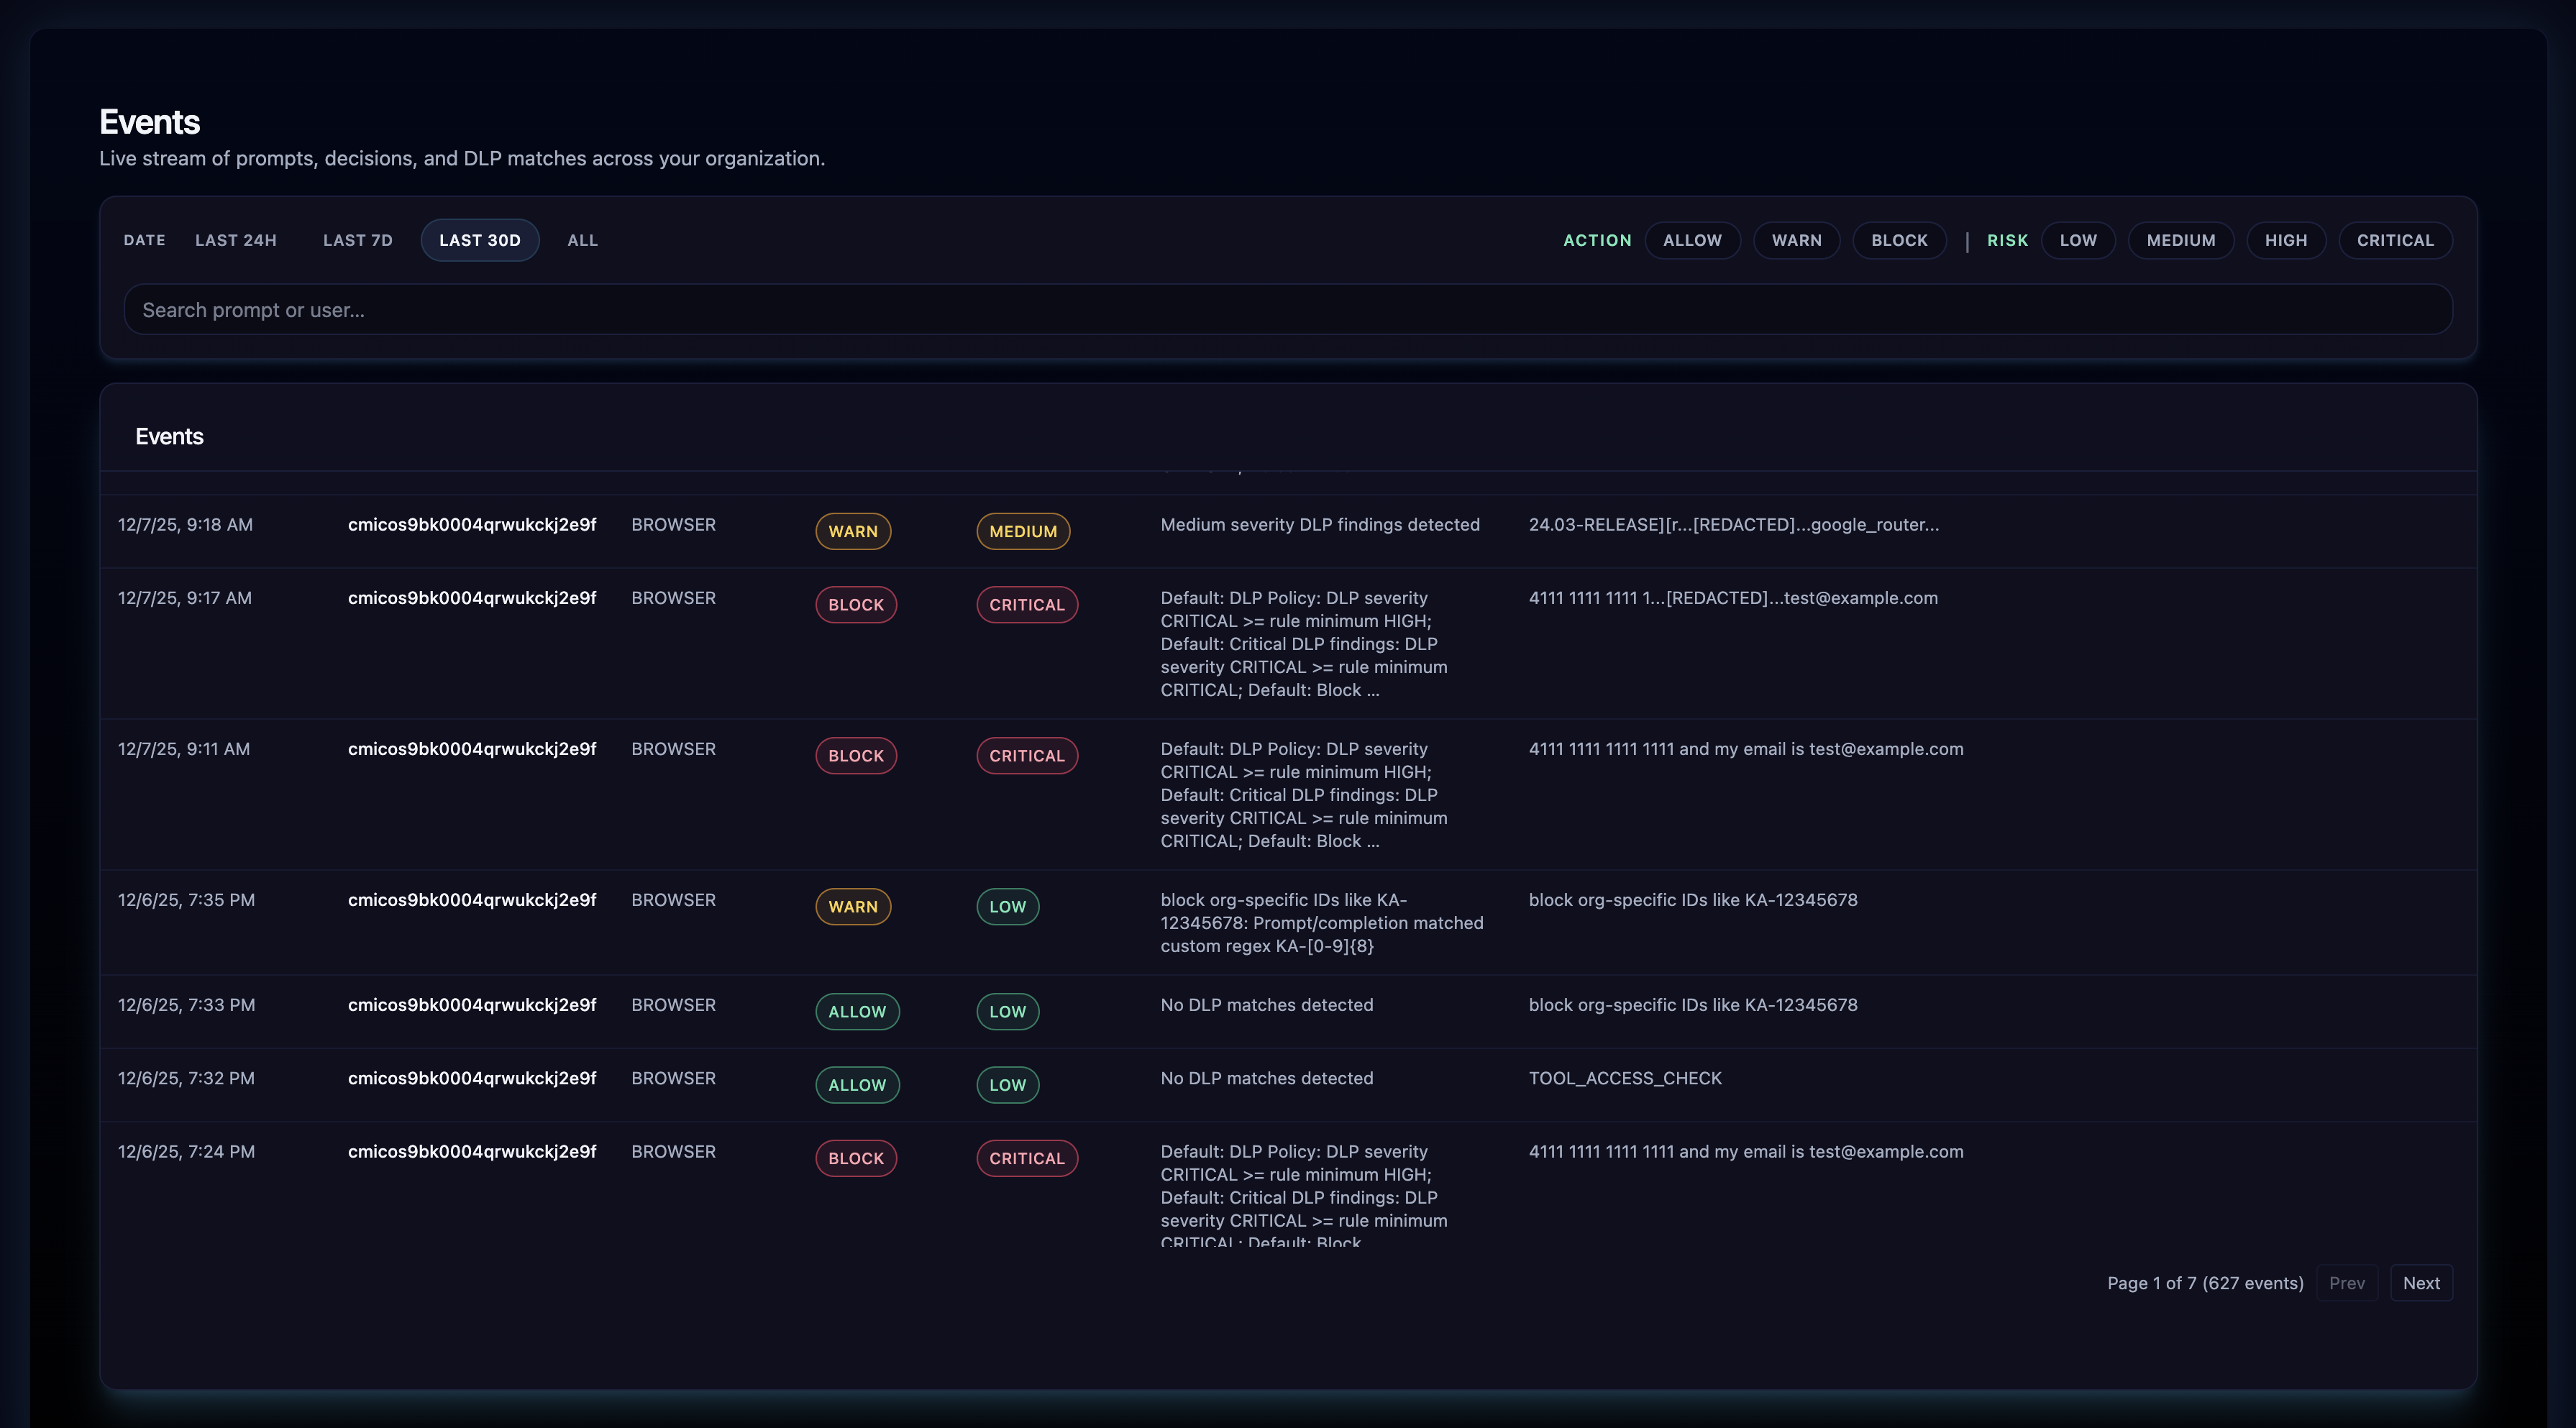
Events in the Admin Console
Powerful views for investigations and analytics.
Events list & DLP details
Filter by org, user, AI tool, action, or severity; identify DLP-related events.
Each event includes DLP summary: isDlpEvent, blockedByDlp, maxSeverity, highOrAbove/critical, totalMatches. Dedicated DLP details returns full match list.
Aggregated event analytics
Allow/warn/block counts, DLP events, high/critical DLP, top patterns (up to 20), last 7-day buckets. Capped scans (e.g., 5,000 events) for predictable performance.
Shadow AI Telemetry & Findings
Raw signals plus curated findings tied to inventory and governance.
ShadowAiEvent
Raw telemetry of unapproved/unknown AI usage with severity and context.
ShadowAiFinding
Curated findings linked to inventory and governance use cases; drives dashboards and remediation workflows.
Ops & Health via Events
24h operational snapshot built on event and endpoint data.
Operational signals
- Database health and connectivity
- Evaluate error rate
- DLP coverage and block rates
- High/critical DLP counts & top patterns
- Active endpoints 24h/30d vs subscription limits
- Notification success/failure and last errors
Questions it answers
- Is the extension working?
- Are policies and DLP actually firing?
- Are we nearing subscription limits?
- Are alerts reaching downstream systems?
Why It Matters
End-to-end visibility, evidence for compliance, actionable analytics, and reliable routing into your SIEM, SOC tools, and collaboration channels.
End-to-end visibility
Every AI interaction captured with context.
Auditable evidence
Compliance-ready logs and DLP details.
Actionable analytics
Tune policies, DLP, and governance from real data.
Operational confidence
Know the AI security & governance layer is working.